

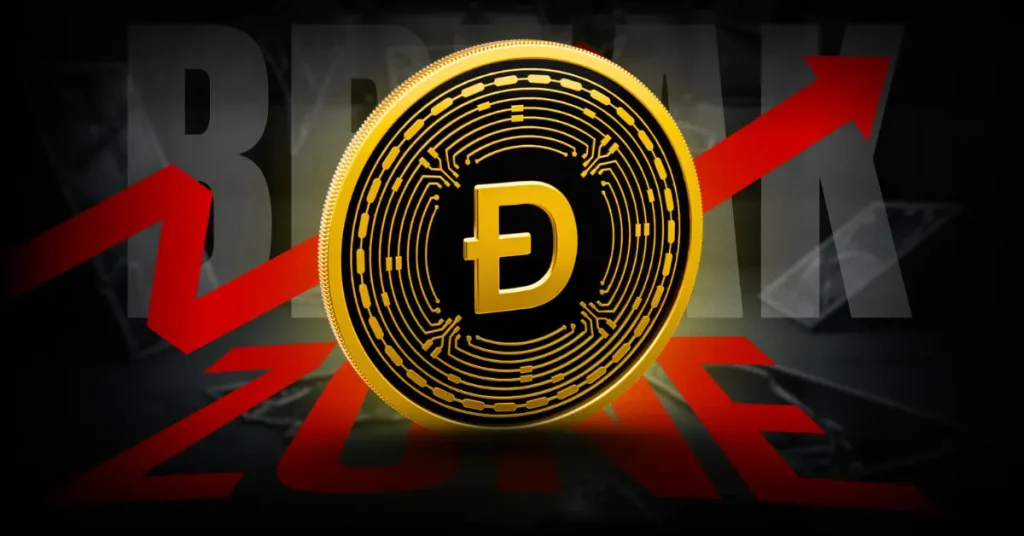
LINK Bullish Pennant Forms As Chainlink Buy Volume Rebounds10h ago| bitcoinist.com
Chainlink is drawing technical attention after chart analysis pointed to a bullish pennant forming on LINK, with buy volume beginning to recover as pr
 LINK
LINK
Chainlink is drawing technical attention after chart analysis pointed to a bullish pennant forming on LINK, with buy volume beginning to recover as pr

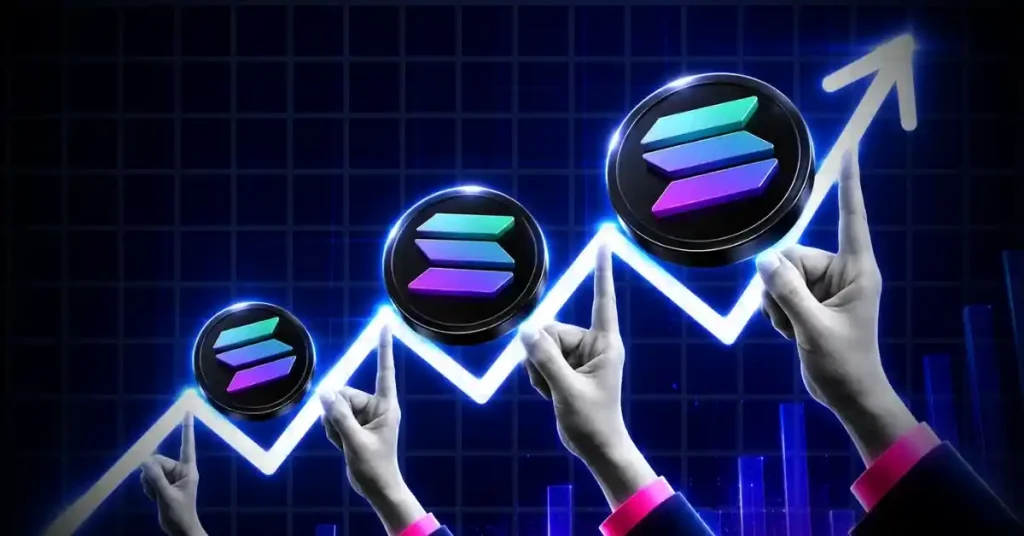
SUI is drawing fresh attention from technical traders after chart analysis pointed to a bullish flag pattern forming on the daily chart.

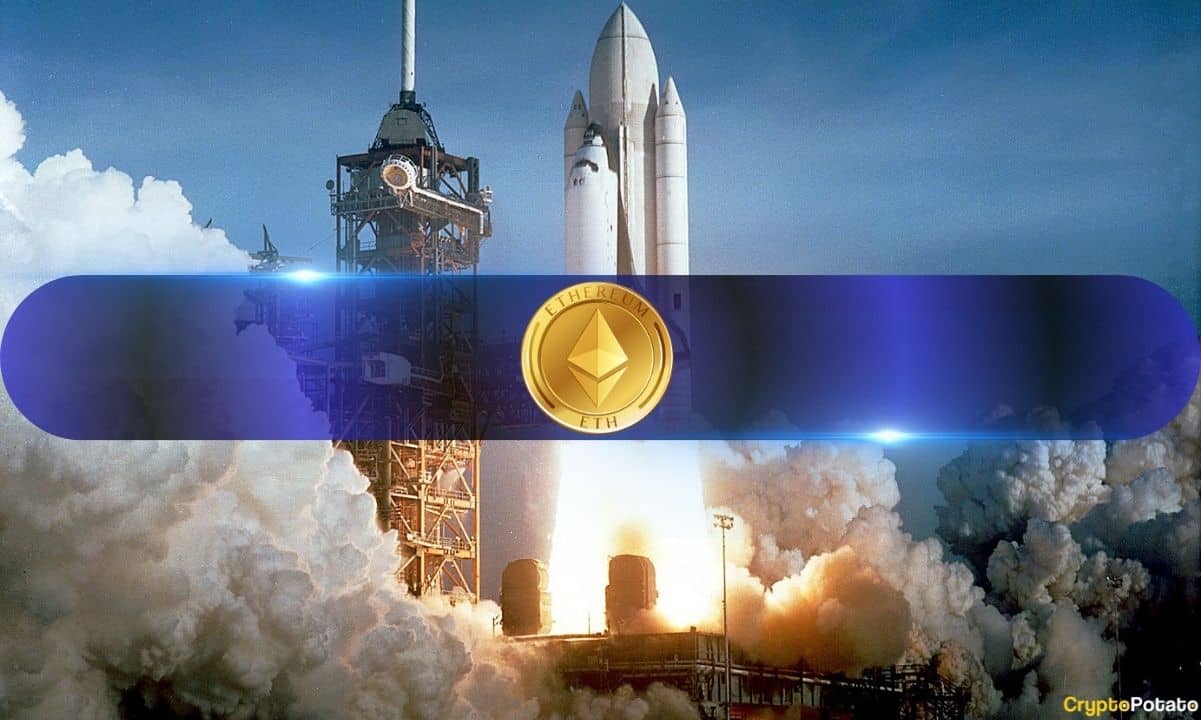
The projected upside depends on Ethereum first overcoming key resistance levels before any larger advance can unfold.

Tokenized Gold (XAUa) tops $1 million in XRP Ledger trading volume amid surging XRPL adoption, 8 million accounts, 70 million XRP accumulated by whales, and growing enterprise interest.

The post Solana Price Holds Key Support Despite Falling Open Interest—What’s Next for SOL? appeared first on Coinpedia Fintech News The Solana (SOL) price has paused its recent recovery after failing to break above the $88 resistance zone, with profit-taking pushing the token back toward $75. Despite the pullback, the broader recovery structure remains intact as SOL continues to trade within an ascending channel. Traders are now watching whether buyers can defend channel support and …

ONDO survived a team-linked exchange deposit, but can buyers absorb continued whale selling?


One other analyst expects these fluctuations to arrive as early as this weekend.
Pump.fun transferred another 81,712 SOL, worth roughly $6.15 million, to crypto exchange Kraken on July 18, 2026, according to on-chain analyst EmberCN. On its own, the move is just another wallet transfer. But in the context of slowing memecoin activity and weakening Solana network revenue, it offers another glimpse into how one of crypto’s biggest...


Is this XRP's path forward and toward a $1 trillion market cap?

TL;DR: Six-month low: The Bitcoin Put/Call ratio dropped to the 0.59 level, indicating a dominance of buy contracts (calls) over sell contracts (puts) in the options market. Volatility compression: Bitcoin’s implied volatility index (DVOL) recorded a drop from 48 to 40 points as the price recovered from its June lows. Liquidity zones: The Glassnode platform ... Read more

XRP is in a tricky position right now.
The post Dogecoin Consolidates at Key Demand Zone—Can Buyers Trigger a Trend Reversal? appeared first on Coinpedia Fintech News Dogecoin price has spent the past few weeks under sustained selling pressure, extending its broader downtrend after losing the key $0.091 support level. The memecoin is now trading around $0.072, placing it just above a major weekly demand zone that has historically attracted buyers during previous corrections. While the overall market structure remains bearish, the …

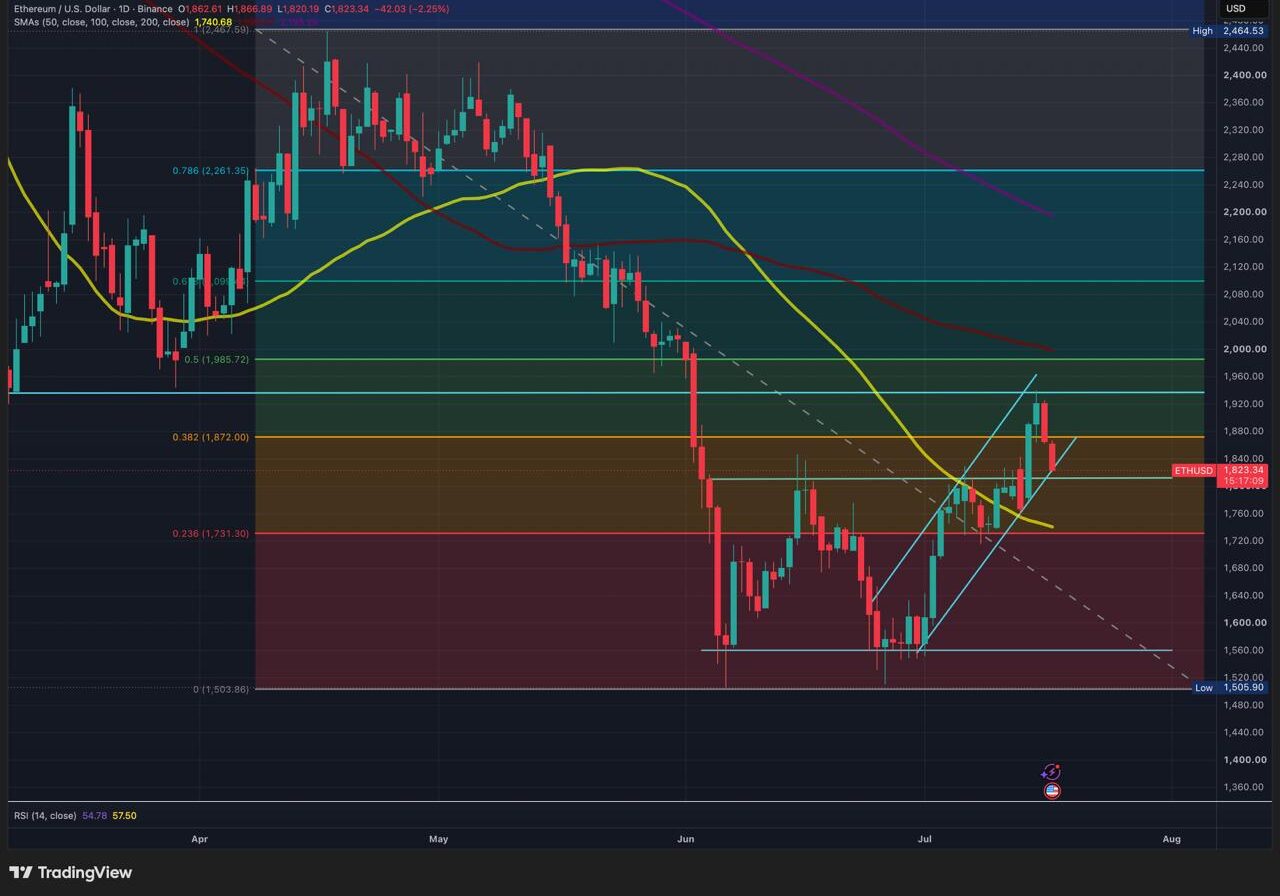
Key Takeaways ETH was rejected near $1,930 and lost the 0.382 Fibonacci retracement during the pullback. Price is now testing […] The post Ethereum Loses Key Fib Level as Open Interest Slides to $11.5B appeared first on Coindoo.
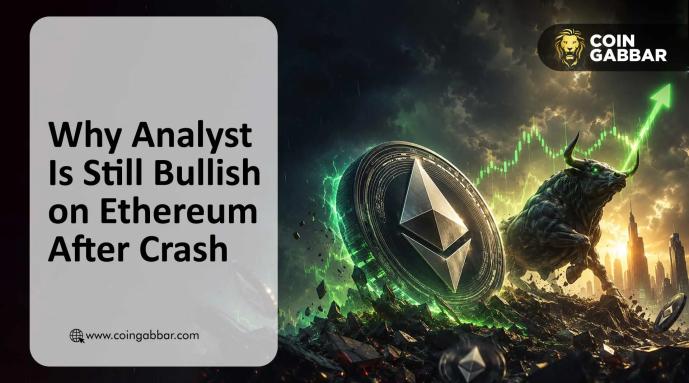
Ethereum is trading near $1,830 this week, down sharply from its recent highs. The drop has left many traders asking if the bleeding is over.But a few analysts are pointing at old chart patterns and wallet data that suggest the coin might be setting up for a bigger move.Let’s discuss how long Ethere...

Key takeaways Pi Network (PI) is showing signs of recovery after several days of consolidation and easing selling pressure. Rising Open Interest suggests speculative traders are positioning for a potential rebound. The upcoming Stellar Protocol v25 mainnet upgrade and improving market sentiment could support PI’s recovery. Pi Network (PI) posted modest gains on Friday after […] The post PI eyes rebound as Open Interest rises and oversold conditions deepen appeared first on CoinJournal.
A detailed breakdown of the performance of ADA, SOL, and ETH and some of the latest forecasts.

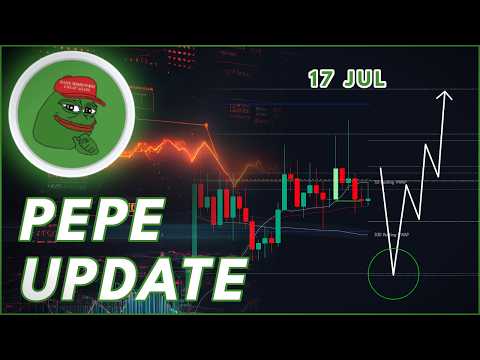
PEPE PRICE PREDICTION 2026 Join the Premium Signal Group for trade setups, mentorship & a community focused on real ...

BITCOIN BTC PRICE PREDICTION 2026 Join the Premium Signal Group for trade setups, mentorship & a community focused ...
West Texas Intermediate (WTI) – the benchmark US crude oil price – edges higher during the Asian session on Friday, though it remains confined within a multi-day-old range.

ISRG — daily chart with candlesticks, EMA20/EMA50 and volume. Intuitive Surgical, Inc. Stock Remains Under Pressure After Earnings Sell-Off Intuitive Surgical, Inc. stock closed at $402.33 on July 16, 2026, tumbling 9% after beating Q2 estimates by $0.29. Selling the news on strong results confirms investor sentiment has already shifted bearish. Key takeaways ISRG closed […]
Load more news